Chesapeake Bay Climate Adaptation Toolbox
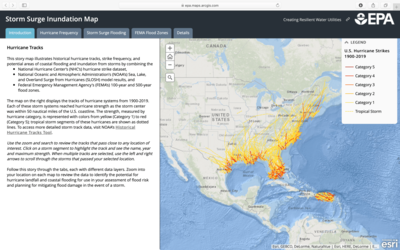
Creating Resilient Water Utilities: Storm Surge Inundation Map
Developed By: Environmental Protection Agency (EPA)
Summary: Part of the Creating Resilient Water Utilities (CRWU), the Storm Surge Inundation tool is a map interface depicting extreme weather conditions. The tool can assist with exploring hazards and assessing neighborhood vulnerability/risk as part of coastal resiliency and emergency preparedness.
This easy-to-use tool includes a collection of maps which show historical hurricane tracks and strike frequency, as well as areas vulnerable to coastal flooding. The hurricane maps show the tracks and strike frequency of all historical hurricanes from 1900-2015 based on the National Hurricane Center’s hurricane strike dataset. This tool also provides two different maps to portray coastal flood vulnerability: a storm surge inundation map based on results form NOAA’s SLOSH (Sea Lake and Overland Surges from Hurricanes) model, and a FEMA Flood Zones map displaying the 100-year and 500-year FEMA flood zones. Within each map, users can search for or navigate to an area of interest. This tool also provides thorough supporting information, defining map attributes and data sources.
Get This Tool: https://epa.maps.arcgis.com/apps/MapSeries/index.html?appid=852ca645500d419e8c6761b923380663
Geographic Coverage
- Contiguous United States
Tags
- Historical
- Real-time/Current
- Grid based
- Computer application
Cost
- Free
Skill Level
- Low